
File:Electroglottographic Wavegram.png
Jump to navigation
Jump to search
Size of this preview: 525 × 600 pixels. Other resolutions: 210 × 240 pixels | 420 × 480 pixels | 963 × 1,100 pixels.


Original file (963 × 1,100 pixels, file size: 359 KB, MIME type: image/png)

Summary
| Description |
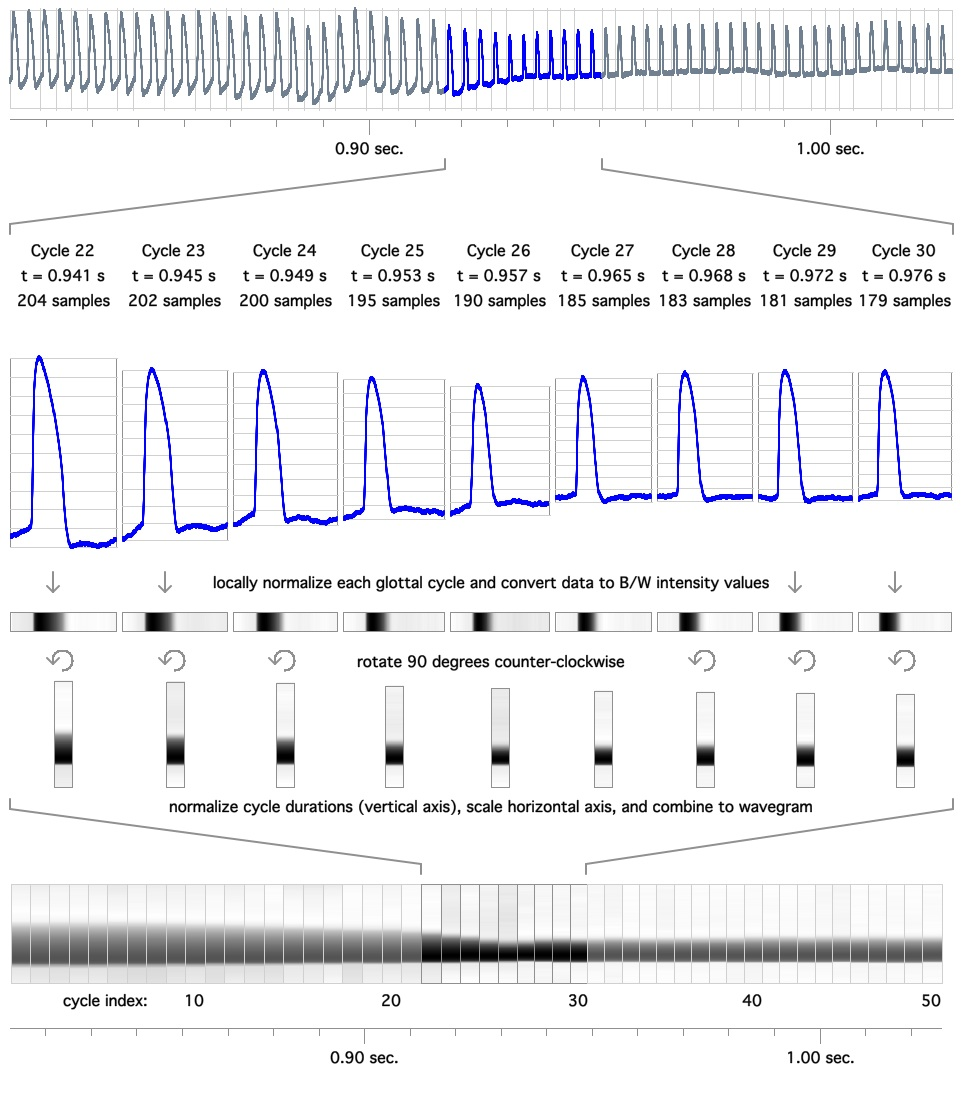
English: How to create an electroglottographic wavegram: (a) extraction of consecutive glottal cycles from the EGG signal; (b) locally normalized data values are converted into monochrome color information, and are plotted as a strip representing one glottal cycle each; (c) strips are rotated 90 degrees counter-clockwise; (d) Glottal cycle duration is normalized by scaling the individual glottal cycle plots to the same height; (e) the resulting graphs are combined to form the final display, the EGG wavegram. |
| Date | |
| Source | Own work |
| Author | Herbst |
Licensing
I, the copyright holder of this work, hereby publish it under the following license:


This file is licensed under the Creative Commons Attribution-Share Alike 3.0 Unported license.
- You are free:
- to share – to copy, distribute and transmit the work
- to remix – to adapt the work
- Under the following conditions:
- attribution – You must give appropriate credit, provide a link to the license, and indicate if changes were made. You may do so in any reasonable manner, but not in any way that suggests the licensor endorses you or your use.
- share alike – If you remix, transform, or build upon the material, you must distribute your contributions under the same or compatible license as the original.
File history
Click on a date/time to view the file as it appeared at that time.
| Date/Time | Thumbnail | Dimensions | User | Comment | |
|---|---|---|---|---|---|
| current | 23:36, 7 March 2025 | No thumbnail | 963 × 1,100 (359 KB) | wikimediacommons>Mikhail Ryazanov | consistent units ("second" is "s", not "sec.") |
File usage
The following 3 pages use this file:
